Tell us about the job
Takes about a minute. No obligation.
A contractor quoting a boiler installation in Chattooga County starts from what the local climate has already established as normal load. 106 severe weather events were recorded in Chattooga County, Georgia between 2015 and 2024. At that rate, severe weather is a standing condition here, and a system sized or sealed for milder assumptions will run short of what the house actually needs. Pipe connections, expansion fittings, and heat exchanger specs that pass elsewhere get looked at harder here, because the weather that comes through this county tests them.
Ductwork laid down for one generation of equipment rarely transfers cleanly to the next. Half the homes in Chattooga County, Georgia were built in 1976 or earlier (2020-2024 ACS 5-year). What a licensed contractor has to work out, before anything else on a boiler job here, is whether the existing distribution system can carry what the new unit needs, and what it will cost to bring the electrical service in line. The pipe runs, the panel, and the existing distribution are the variables that move the price. The boiler itself is the fixed part.
What a Boiler Installation Puts in Your Home
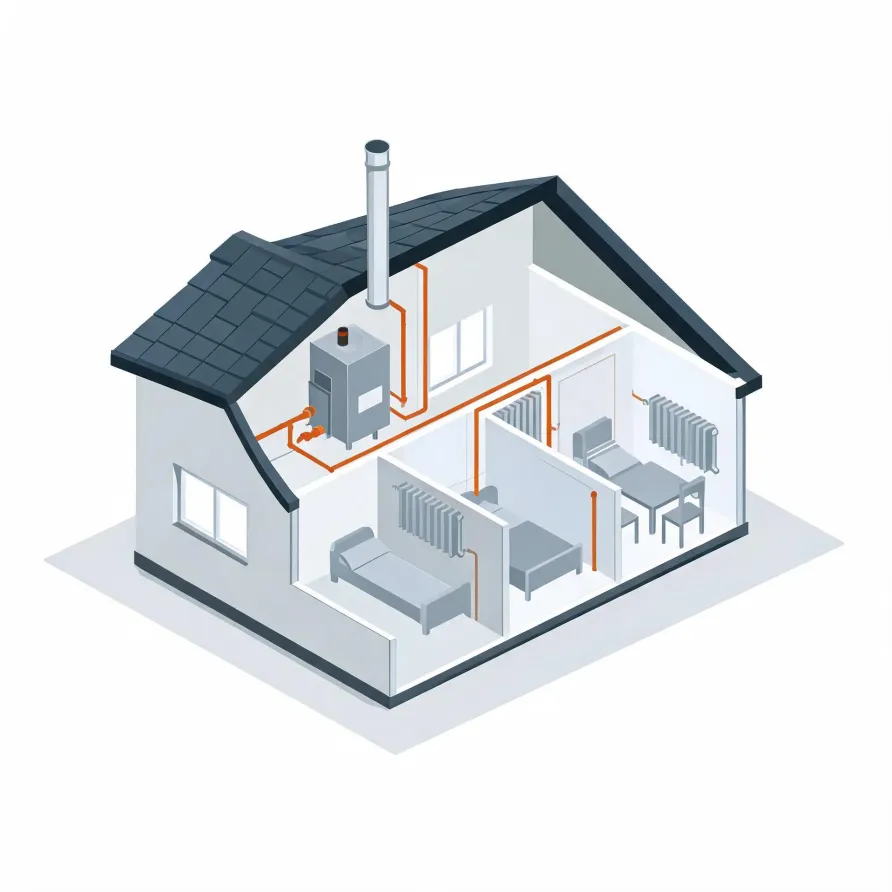
The boiler itself sits in a mechanical room, basement, or utility closet and is the unit that heats the water that feeds the rest of the system. Wall-mounted or floor-standing, it is the largest single piece a contractor brings in. The expansion tank mounts close beside it, holding the pressure of the system steady as water heats and cools.
From the boiler, supply and return pipes run through the house to the heat emitters, which are either radiators standing against the walls or radiant tubing laid beneath the floors. A circulator pump, mounted on the piping near the boiler, keeps the heated water moving through that loop. A mixing valve and the thermostat round out what a contractor connects before the system is ready to run.
The drawing shows a typical boiler layout, and a licensed contractor will determine exactly which components and configurations apply to your house.
Get matched in Chattooga CountyChattooga County, by the numbers
106 severe weather events were recorded in Chattooga County, Georgia between 2015 and 2024.
NOAA National Centers for Environmental Information, Storm Events Database, bulk CSV export, events 2015-01-01 through 2024-12-31.Half the homes in Chattooga County, Georgia were built in 1976 or earlier (2020-2024 ACS 5-year).
U.S. Census Bureau, 2020-2024 American Community Survey 5-Year EstimatesChattooga County, Georgia holds 10,882 housing units (2020-2024 ACS 5-year).
U.S. Census Bureau, 2020-2024 American Community Survey 5-Year EstimatesOwners occupy 66.8% of the occupied homes in Chattooga County, Georgia (2020-2024 ACS 5-year).
U.S. Census Bureau, 2020-2024 American Community Survey 5-Year EstimatesSevere Weather Events in Chattooga County
Georgia's climate puts real demands on heating equipment, and those demands vary by where you live. A boiler sized and installed for local conditions holds up better than one spec'd to a national average.
106 severe weather events, 2015–2024. Source: NOAA National Centers for Environmental Information, Storm Events Database.